Introduction to Dashboards and Data Visualization
Dashboards and data visualization are essential components of any data-driven application, providing users with a clear and concise overview of key performance indicators (KPIs) and trends. In this article, we will explore the process of developing dashboards and data visualization using CodeIgniter, a popular PHP framework.CodeIgniter is a powerful tool for building web applications, and its modular design makes it an ideal choice for creating custom dashboards and data visualization. With CodeIgniter, developers can quickly and easily create interactive and dynamic dashboards that provide real-time insights into business operations.
Setting Up CodeIgniter for Dashboards and Data Visualization
To get started with developing dashboards and data visualization using CodeIgniter, you will need to set up a new CodeIgniter project. This involves downloading and installing the CodeIgniter framework, as well as configuring the database and setting up the basic directory structure.Once you have set up your CodeIgniter project, you will need to install the necessary libraries and plugins for creating dashboards and data visualization. Some popular libraries include Chart.js, D3.js, and Google Charts.Additionally, you will need to configure the database to store and retrieve data for your dashboards and data visualization. This can involve setting up tables and relationships, as well as creating models and controllers to interact with the database.
Designing Effective Dashboards
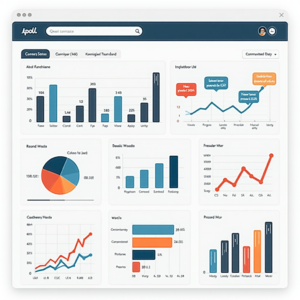
When designing dashboards, it’s essential to keep in mind the principles of effective dashboard design. This includes keeping the dashboard simple and intuitive, using clear and concise language, and providing interactive and dynamic visualizations.A well-designed dashboard should provide users with a clear overview of KPIs and trends, as well as enable them to drill down into specific data points for further analysis. This can involve using a combination of charts, tables, and filters to provide users with a comprehensive view of the data.Some popular types of dashboards include executive dashboards, operational dashboards, and analytical dashboards. Each type of dashboard has its own unique characteristics and requirements, and developers should carefully consider the needs and goals of the users when designing the dashboard.
Creating Interactive Data Visualizations
Interactive data visualizations are a key component of effective dashboards, providing users with a engaging and dynamic way to explore and analyze data. Some popular types of data visualizations include line charts, bar charts, scatter plots, and heat maps.To create interactive data visualizations using CodeIgniter, developers can use a combination of JavaScript libraries and PHP code. This involves using libraries such as Chart.js and D3.js to create the visualizations, and then using PHP to retrieve and manipulate the data.Additionally, developers can use CodeIgniter’s built-in tools and features to create interactive and dynamic visualizations. This includes using controllers and models to retrieve and manipulate data, and then using views to render the visualizations.
Example Code for Creating a Dashboard with CodeIgniter
The following is an example of how to create a simple dashboard using CodeIgniter and Chart.js:First, create a new controller in the application/controllers directory, and add the following code:
    <?php
    defined('BASEPATH') OR exit('No direct script access allowed');

    class Dashboard extends CI_Controller {

      public function index() {
        $data['title'] = 'Dashboard';
        $this->load->view('dashboard', $data);
      }

    }
    ?>
Next, create a new view in the application/views directory, and add the following code:
    <html>
    <head>
      <title><?= $title ?></title>
      <script src="https://cdn.jsdelivr.net/npm/chart.js@2.9.3/dist/Chart.min.js"></script>
    </head>
    <body>
      <canvas id="myChart"></canvas>
      <script>
        var ctx = document.getElementById('myChart').getContext('2d');
        var chart = new Chart(ctx, {
          type: 'line',
          data: {
            labels: ['January', 'February', 'March', 'April', 'May'],
            datasets: [{
              label: 'Sales',
              data: [100, 200, 300, 400, 500],
              backgroundColor: 'rgba(255, 99, 132, 0.2)',
              borderColor: 'rgba(255, 99, 132, 1)',
              borderWidth: 1
            }]
          },
          options: {
            scales: {
              yAxes: [{
                ticks: {
                  beginAtZero: true
                }
              }]
            }
          }
        });
      </script>
    </body>
    </html>
This code creates a simple dashboard with a line chart using Chart.js. The chart displays sales data for the months of January through May.
Conclusion
In conclusion, developing dashboards and data visualization using CodeIgniter is a powerful way to create interactive and dynamic visualizations for users. By leveraging the framework’s modular design and built-in tools and features, developers can quickly and easily create custom dashboards that provide real-time insights into business operations.Some best practices for developing dashboards and data visualization include keeping the dashboard simple and intuitive, using clear and concise language, and providing interactive and dynamic visualizations. Additionally, developers should carefully consider the needs and goals of the users when designing the dashboard.By following these guidelines and using the example code provided, developers can create effective dashboards and data visualization using CodeIgniter, and provide users with a valuable tool for exploring and analyzing data.